Setting up Grafana with Trench
This guide will walk you through setting up Grafana with Trench to visualize your analytics data.Prerequisites
- Docker installed
- Trench running locally follow Self-host Quickstart
Setup Steps
1
Run Grafana Container
Run the following command to start Grafana. This will make Grafana available at http://localhost:3001 and connect it to your Trench installation.
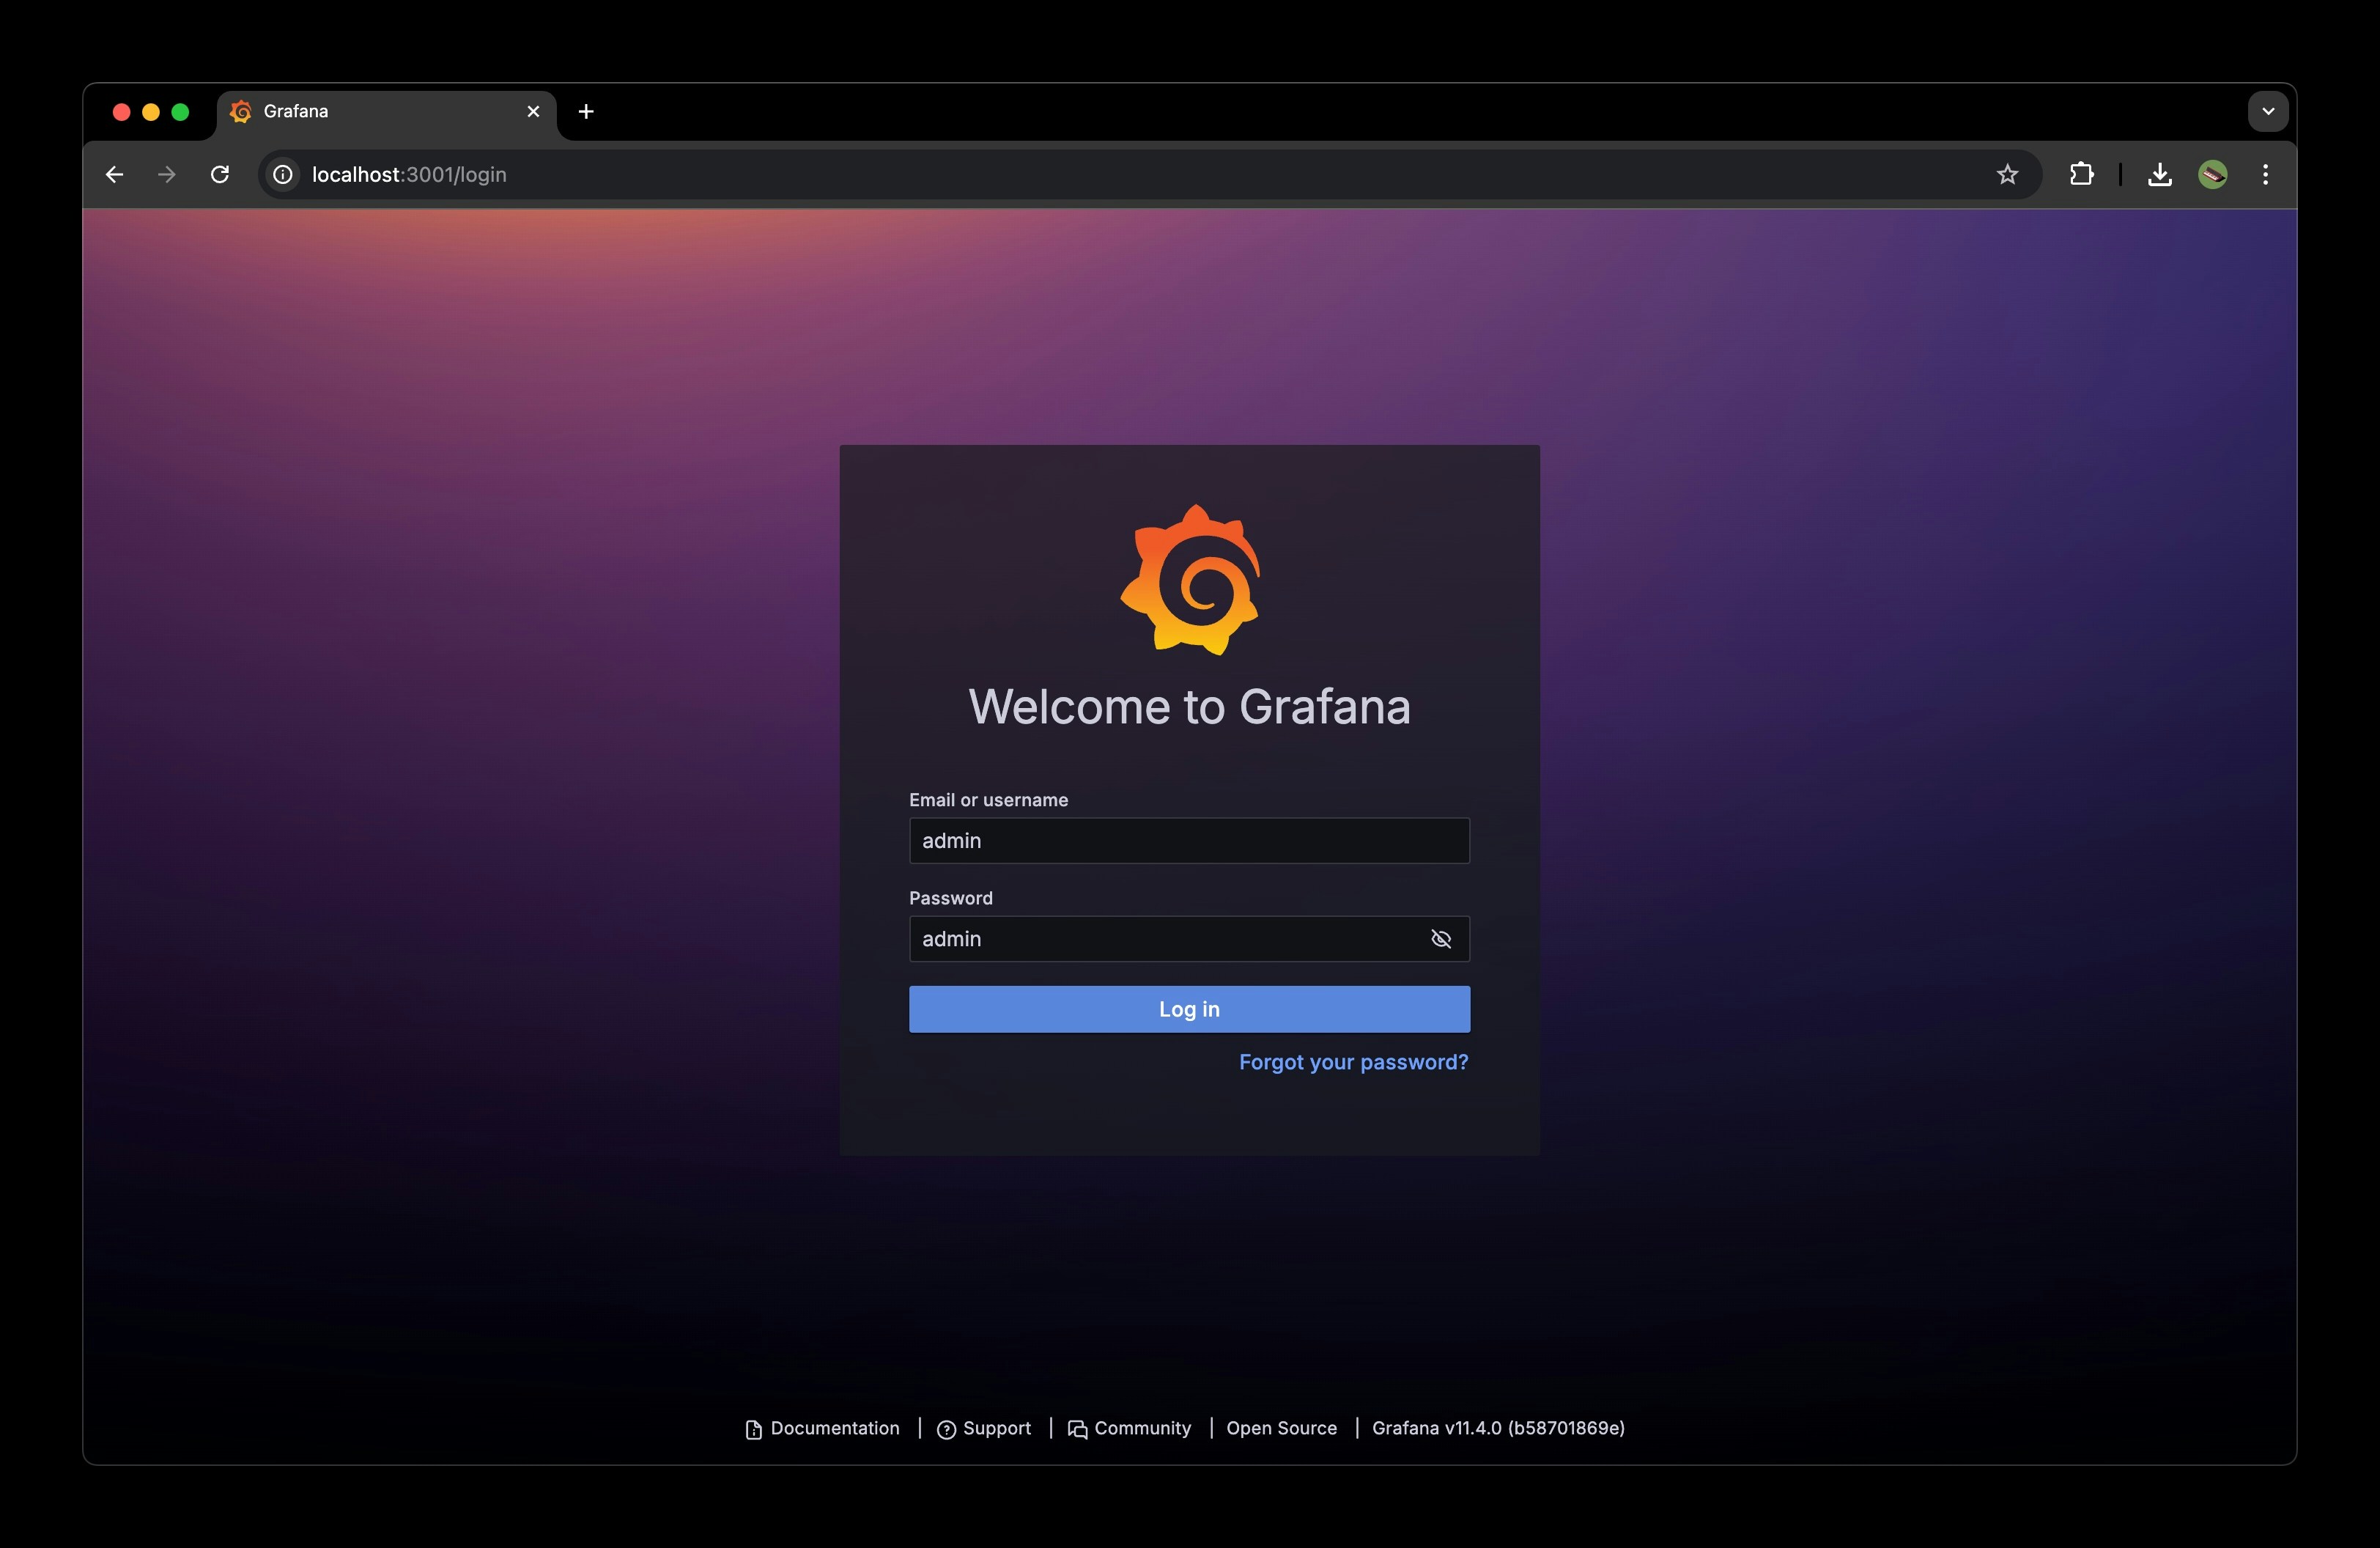
2
Login to Grafana, use default credentials:
- Username:
admin - Password:
admin
3
Install the ClickHouse plugin in Grafana.
Go to plugins section and install the ClickHouse plugin.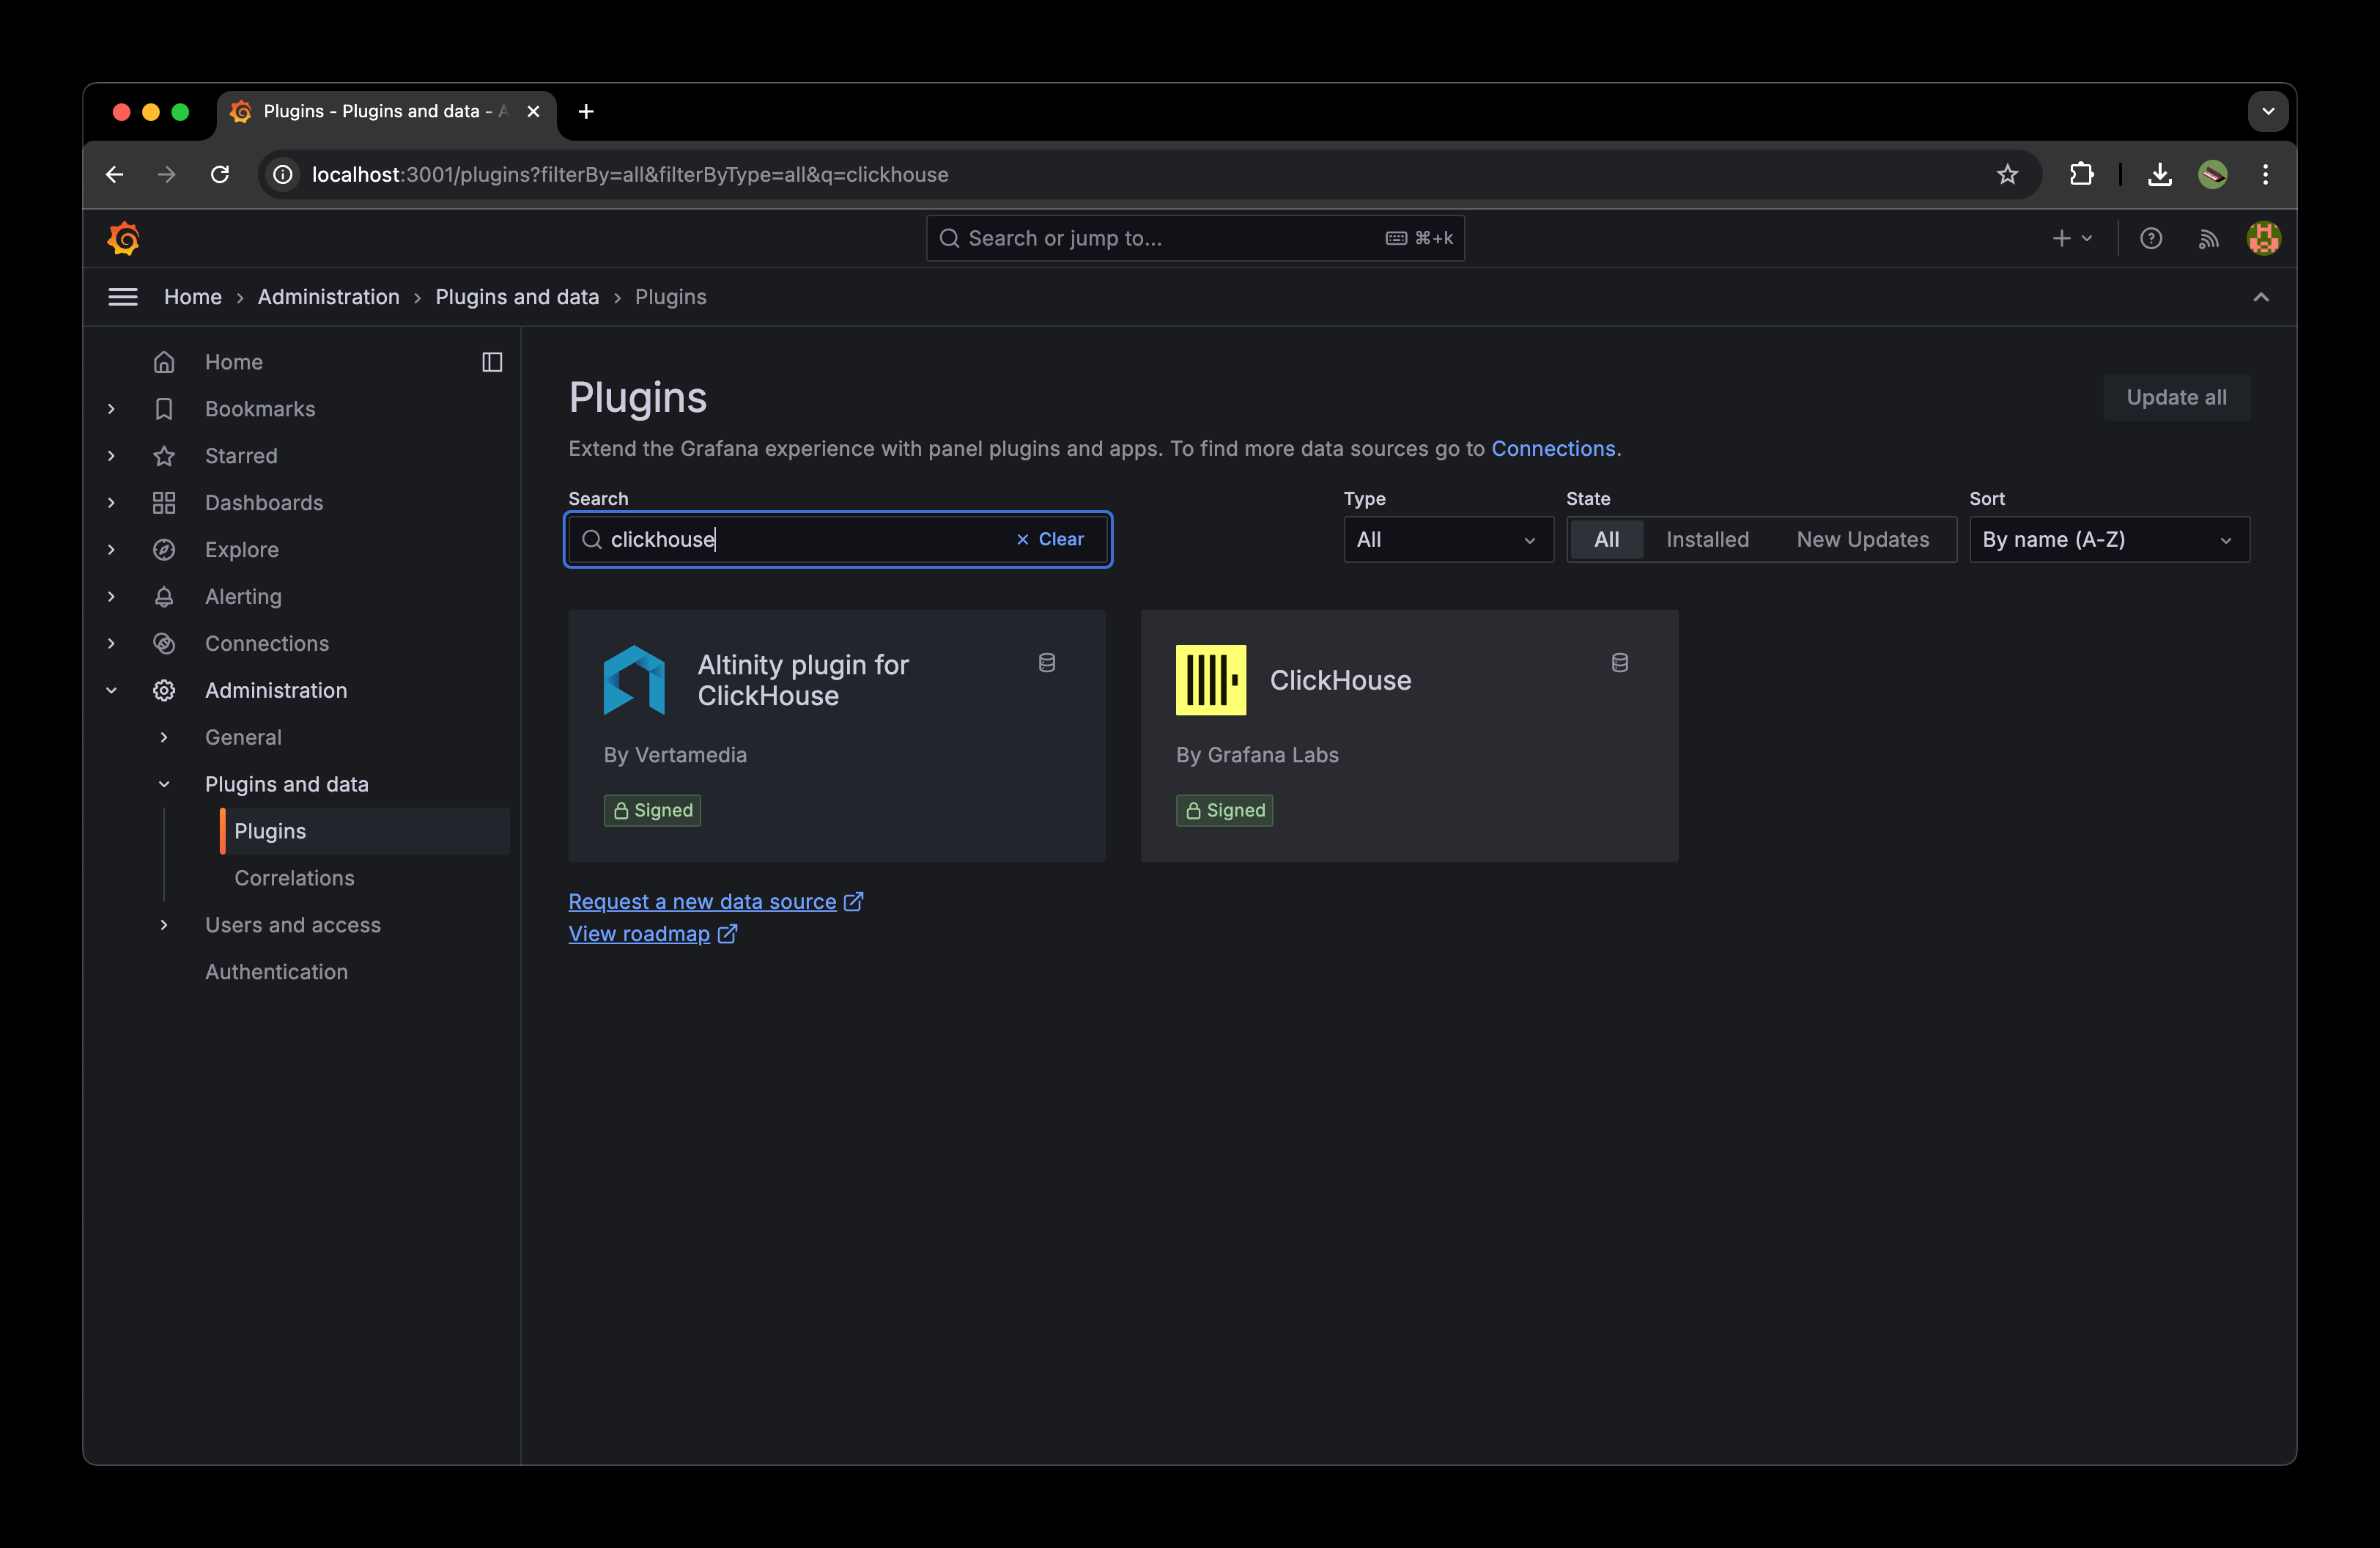
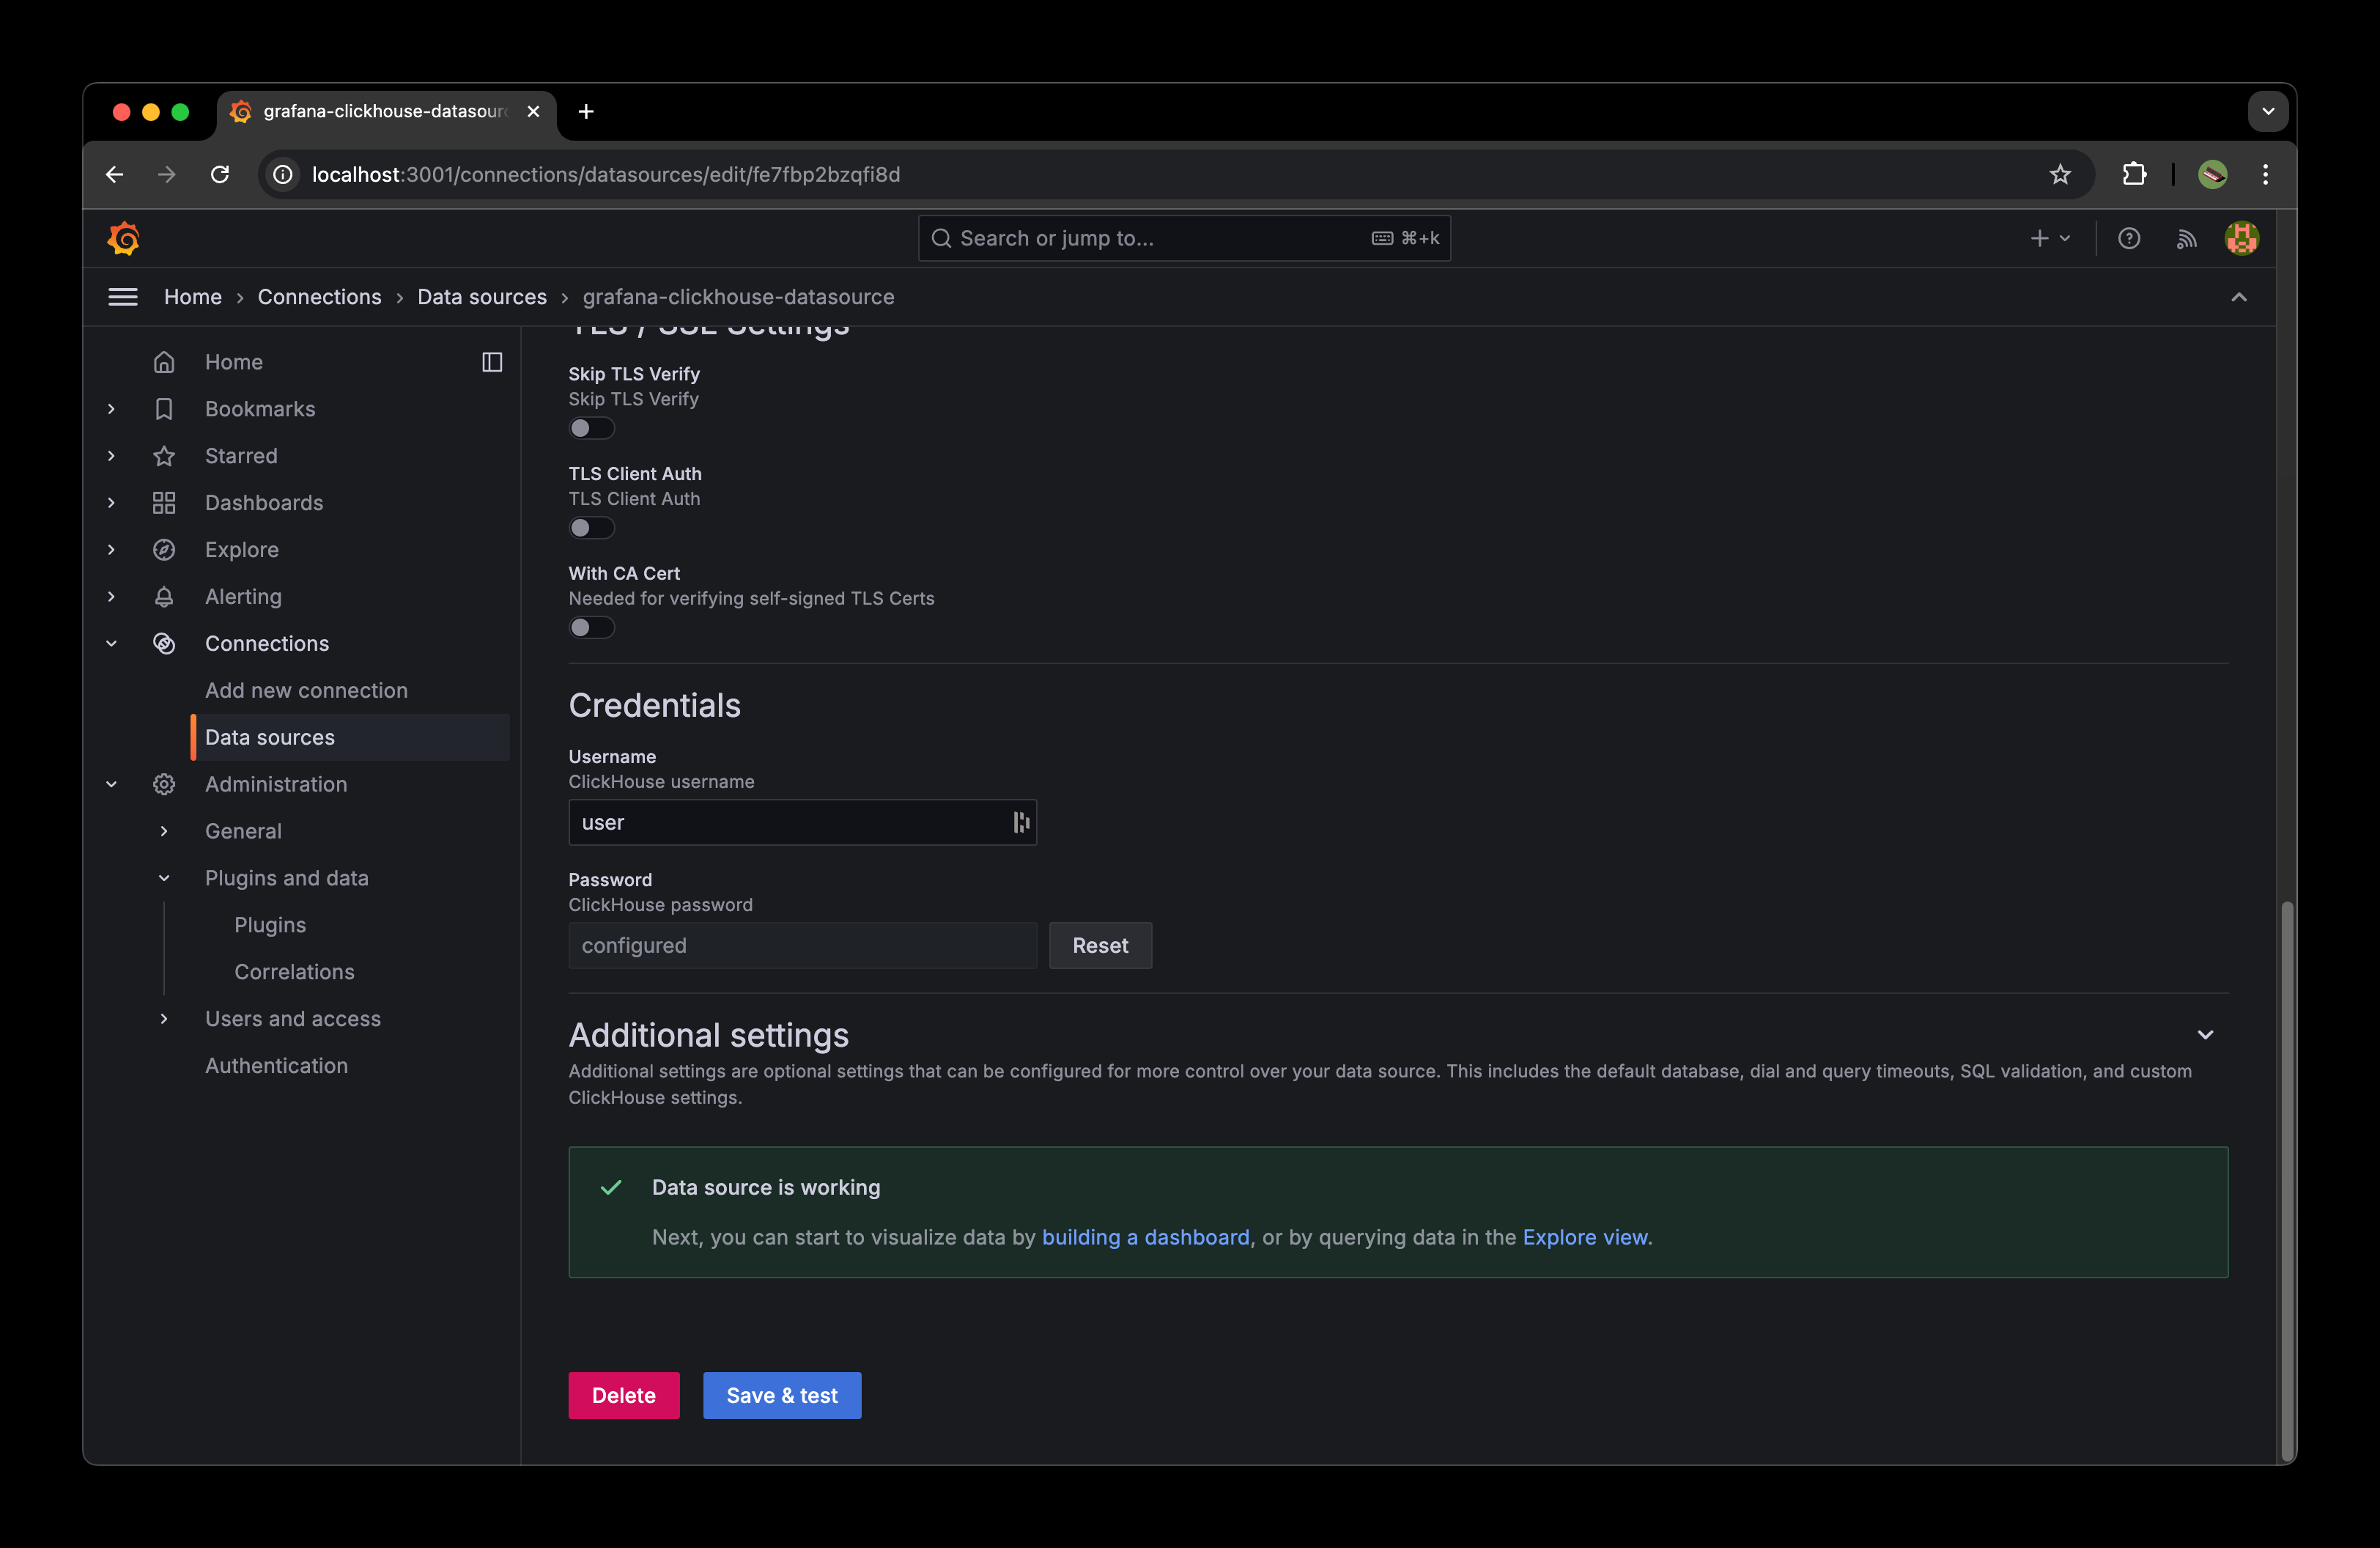
4
Configure ClickHouse Data Source
- Go to Data Sources section and click on
Add data source. - Select
ClickHouseas the data source. - Configure the data source with these settings:
- Host:
clickhouse - Port:
8123 - Protocol:
http - Username:
user - Password:
password
- Host:
5
Setup Grafana Dashboard
You can import the pre-built dashboard using the JSON configuration provided. Download the JSON configuration and import it into Grafana.The Dashboard includes:
- Unique pageviews over time
- Time series visualization
- 6-hour time window by default
6
Test Setup
Here’s an example of sending pageview data:
7
View the dashboard
New pageviews should be visible in the dashboard.
Next Steps
- Customize the dashboard based on your needs
- Add more panels for different metrics
- Set up alerts